The map functionality in Reporting Services may seem a little bit outdated with all the nice and interactive fancy maps for example in Power BI. However, standard reports still play an important role for distributing information in an enterprise and so do maps in the reports. Microsoft Reporting Services relies on Bing maps as the tile layer for map reports. You can choose between different map styles (road, arial, hybrid) but you cannot use any other tile server (like OpenStreetMap for example). Since the map is loaded when the report renders, you will also need to have an internet connection for your SSRS server, which is usually the case. But in a recent project the requirement was to block the report server from connecting to external ressources and to use tiles from a GIS server in the local network instead.
If you want to import OpenStreetMap spatial data (points, lat/lon coordinates, polygons etc.) into SQL Server there are some very useful ressources that make this process very easy. You can start with osm2mssql and I also blogged about implementing the import process using Microsoft Integration Services . However, when it comes to using a different map tile provider for Reporting Services’ map tile layer, you’re more or less on your own.
So, opening reporting services to other map providers is an obvious requirement and there is also a Microsoft Connect entry for this . Feel free to vote for this requirement, however since it is open since March 2011 I wouldn’t be overoptimistic to see this feature implement in the near future. So this post is about alternative methods of opening SSRS to other map servers. The key idea is to use the SSRS functionality for a proxy server and to create a custom proxy that handles the communication to the map server.
When SSRS renders the report with a map, the map isn’t retrieved in one piece but divided in tiles as shown below:
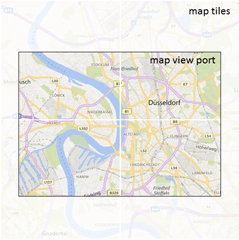
In this example, our viewport requires four map tiles which are separately loaded by Reporting Services. Map tiles are usually pre-compiled images for all available zoom levels on the tile server which allows a very performant way to render a map. The tiles are usually stored by coordinates. You might have noticed the effect of the map being reloaded by tiles in other map applications, especially on a slow internet connection.
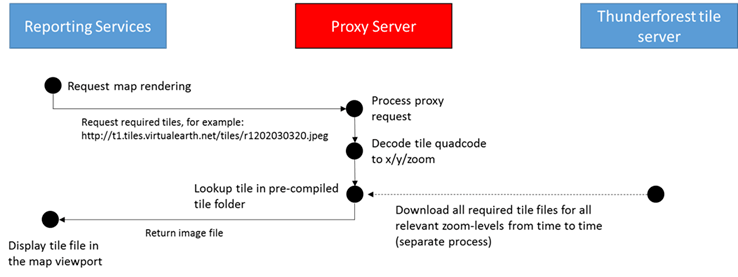
So, when Reporting Services displays a map with a Bing tile layer, it first computes the zoom level and all required tile coordinates, then fetches the tiles from the tile server. If a proxy is in place, the communication to fetch a single tile happens as shown below:
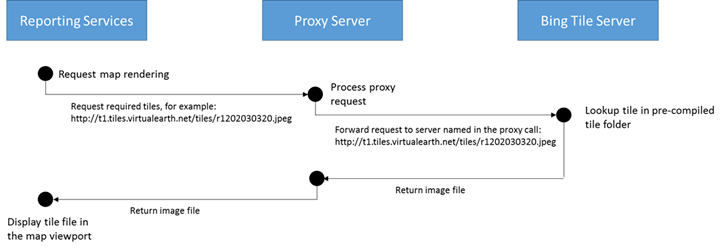
Since we use a proxy server here, the request is routed to the proxy. The proxy in turn forwards the request to the map tile server and then returns the resulting image back to SSRS. The setup of the proxy for SSRS is decscribed here and basically means to edit the web.config file in the ReportServer sub directory below the SSRS instance directory:
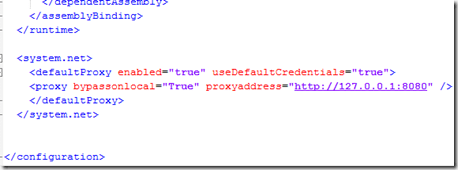
As you see, we’re pointing SSRS to a proxy on the same machine here, since we want to replace the proxy functionality with our own proxy as shown in the diagram below:
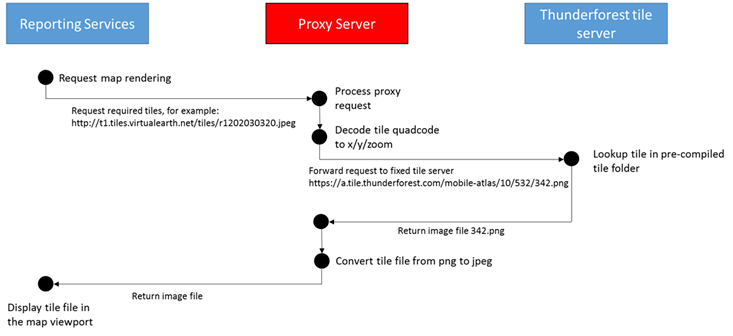
In this example, our custom proxy receives the request for tile r1202030320, where “r” means that we’re asking for a road map and the number is the so called quad code of the tile. The quad code is a very clever way of storing x/y coordinates and zoom level is a single number. Actually, decoding the quad code to x=532, y=342, zoom=10 is quite simple and well explained (including C# code) by Microsoft here . Our custom proxy can then use this information to make a call to a different tile server of your choice. In this case we’re using the OpenStreetMap based tiles from Thunderforest.com. The only remaining task is to convert the image from png (as delivered from Thunderforest.com) to jpeg (as expected by SSRS) and to return the image tile to SSRS. Using this method, SSRS actually believes the communication took place with tiles.virtualearth.net, however our proxy server has transcoded the request for a different tile server.
Using this approach you can also implement an offline map support where SSRS doesn’t need to connect to the internet at all but gets all required tiles directly from the custom proxy server. For this approach you need to crawl the desired tiles at all required zoom levels from time to time and store the resulting tile files locally on the proxy server.
However, before you start downloading tons of tiles please check the terms of use of the individual tile server. Many tile servers that are based on OpenStreetMap offer free basic access (limited number of tiles per week/month) if you add a proper attribution (usually name/link to the service and to OpenStreetMap and its contributors). Especially, accessing OpenStreetMaps’ main tile server is usually not allowed (terms of use ) as these servers are running on donnated ressources and have a strictly limited capacity.
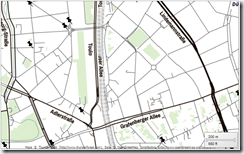
So, how does the result look like? I have included some maps that show the location of cafés in the town of Düsseldorf (map zoom to some detail). All of the following SSRS maps were actually created using Reporting Services using the same report and showing exactly the some area. In fact I just reloaded the report with different proxy server settings in place.
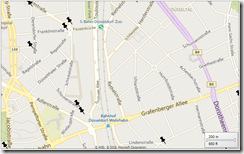 |
This is actually the standard map based on bing maps tiles (no proxy in place) as being rendered by Reporting Services. |
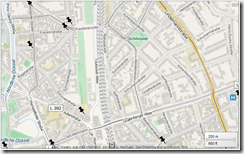 |
This screenshows shows exactly the same area as the map before (same report and report parameters in Reporting Services) but now we’re routing the map request to MapQuest . Please be sure to read and understand their terms of use before accessing tiles from this service. Data, imagery and map information provided by MapQuest, OpenStreetMap and contributors, ODbL |
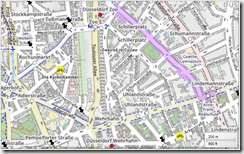 |
This tile rendering has been created using Thunderforest ’s OpenCycleMap profile. Again, please make sure you have read and understood their terms of use before using this service. They also offer access for high volume tile requests. You can find the price for the different service level on their homepage. At the time of writing, usage is free for hobby projects up to 150,000 tile requests per month if the map is attributed properly. |
 |
Again this rendering has been created based on Thunderforest tiles but this time we used the “Mobile-Atlas” profile resulting in tiles with a very high contrast. |
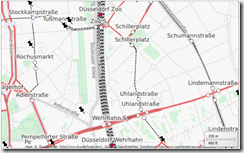 |
This is also a rendering based on Thunderforest tiles, this time with the “Transport” profile. |
I cannot share the source code for the proxy itself here, however it’s not difficult to implement based on some lightweight proxy implementations. You can find a lot of links here .
So with this work around we’re able to use many more map providers in Reporting Services and even support offline/disconnected server scenarios. Personally I prefer bing maps (road maps) for reporting purposes as the maps are very tidy and clear. But now we have the choice.


Kommentare (0)