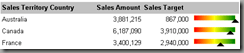
SQL Server 2005 – 2012
After my last blog post , I got a lot of requests for the code I used for the graphics. So this post just shows the source code for the graphics of my last post.
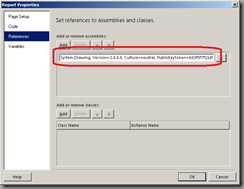
Both examples require that you include a reference to System.Drawing to your report as shown below:
1. The deviation chart element
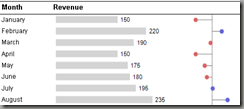
Here is the code used for the last column’s image:
-
Function PaintAbw(ByVal width As Integer, ByVal height As Integer, ByVal min As Single, ByVal max As Single, ByVal middle As Single, ByVal cur As Single) As System.Drawing.Bitmap
-
‚ Draws a vertical deviation chart
-
‚ parameters
-
‚ width/height width and height of the resulting image in pixel
-
‚ min/max minimum and maximum value of the data being passed to the chart
-
‚ middle position of the vertical reference line (usually zero or avg of the data)
-
‚ data points below this value are plotted in red, above this value in blue
-
‚ cur actual value to display
-
Dim objBitmap As System.Drawing.Bitmap
-
Dim objGraphic As System.Drawing.Graphics
-
Dim myBrush As System.Drawing.Brush
-
Dim x0 As Integer, x As Integer
-
‚ Initialize the graphic
-
objBitmap = New System.Drawing.Bitmap(width, height)
-
objGraphic = System.Drawing.Graphics.FromImage(objBitmap)
-
objGraphic.SmoothingMode = System.Drawing.Drawing2D.SmoothingMode.AntiAlias
-
objGraphic.FillRectangle(System.Drawing.Brushes.White, 0, 0, width, height)
-
‚ Draw the vertical line (the „middle“ position)
-
x0 = 8 + ((width – 18) * (middle – min)) \ (max – min)
-
objGraphic.DrawLine(System.Drawing.Pens.Gray, x0, 0, x0, height)
-
If cur < min Then cur = min
-
If cur > max Then cur = max
-
‚ Draw the deviation (line and circle)
-
x = 8 + ((width – 18) * (cur – min)) \ (max – min)
-
objGraphic.DrawLine(System.Drawing.Pens.Gray, x0, height \ 2, x, height \ 2)
-
If cur < middle Then
-
myBrush = New System.Drawing.SolidBrush(System.Drawing.Color.FromArgb(215, 100, 100))
-
Else
-
myBrush = New System.Drawing.SolidBrush(System.Drawing.Color.FromArgb(100, 100, 215))
-
End If
-
objGraphic.FillPie(myBrush, x – 4, height \ 2 – 4, 8, 8, 0, 360)
-
‚ Return the image as type bitmap
-
Return objBitmap
-
End Function
-
Function PaintAbwBmp(ByVal width As Integer, ByVal height As Integer, ByVal min As Single, ByVal max As Single, ByVal middle As Single, ByVal cur As Single) As Byte()
-
‚ Wrapper function for PaintAbw. This function is to be called from reporting services as
-
‚ for parameters see PaintAbw
-
Dim bmpImage As System.Drawing.Bitmap
-
‚ Get bitmap from PaintAbw
-
bmpImage = PaintAbw(width, height, min, max, middle, cur)
-
‚ Convert this bitmap to a byte array of type BMP
-
Dim stream As System.IO.MemoryStream = New IO.MemoryStream
-
Dim bitmapBytes As Byte()
-
bmpImage.Save(stream, System.Drawing.Imaging.ImageFormat.Bmp)
-
bitmapBytes = stream.ToArray
-
stream.Close()
-
bmpImage.Dispose()
-
Return bitmapBytes
-
End Function
Examples
| PaintAbw(100, 20, -100.0, 100.0, 0.0, 50.0) |  |
| PaintAbw(100, 20, 0.0, 100.0, 0.0, 80.0) | 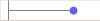 |
| PaintAbw(100, 20, -100.0, 100.0, 0.0, -80.0) | 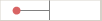 |
Usage within the report as the source for a bitmap

Sample Expression:
=Code.PaintAbwBmp(100,20,Min(Fields!Value.Value, „DataSet1“),Max(Fields!Value.Value, „DataSet1“), Avg(Fields!Value.Value, „DataSet1“), Fields!Value.Value)
2. The KPI slider
Here is the code used for the last column’s image:
-
Function PaintBox(ByVal width As Integer, ByVal height As Integer, ByVal level As Single) As System.Drawing.Bitmap
-
‚ Draws a range chart (blending from red to green)
-
‚ parameters
-
‚ width/height width and height of the resulting image in pixel
-
‚ min/max minimum and maximum value of the data being passed to the chart
-
‚ level position of slide
-
‚ 0: left, 1: right, 0.5 middle
-
‚ make sure you scale this value to your needs
-
Dim objBitmap As System.Drawing.Bitmap
-
Dim objGraphic As System.Drawing.Graphics
-
‚ Initialize the graphic
-
objBitmap = New System.Drawing.Bitmap(width, height)
-
objGraphic = System.Drawing.Graphics.FromImage(objBitmap)
-
objGraphic.SmoothingMode = System.Drawing.Drawing2D.SmoothingMode.AntiAlias
-
objGraphic.FillRectangle(System.Drawing.Brushes.White, 0, 0, width, height)
-
‚ Create color gradient for the background
-
Dim BrushRedYellow As New System.Drawing.Drawing2D.LinearGradientBrush(New System.Drawing.Rectangle(8, 0, (width – 16) \ 2, height), System.Drawing.Color.Red, System.Drawing.Color.Yellow, System.Drawing.Drawing2D.LinearGradientMode.Horizontal)
-
Dim BrushYellowGreen As New System.Drawing.Drawing2D.LinearGradientBrush(New System.Drawing.Rectangle(7 + (width – 16) \ 2, 0, (width – 16) \ 2, height), System.Drawing.Color.Yellow, System.Drawing.Color.Green, System.Drawing.Drawing2D.LinearGradientMode.Horizontal)
-
objGraphic.FillRectangle(BrushRedYellow, 8, 3, (width – 16) \ 2, height – 10)
-
objGraphic.FillRectangle(BrushYellowGreen, 8 + (width – 16) \ 2, 3, (width – 16) \ 2, height – 10)
-
‚ Scale level properly
-
If level > 1 Then level = 1
-
If level < 0 Then level = 0
-
‚ Draw the arrow
-
Dim Arrow(2) As System.Drawing.PointF
-
Arrow(0) = New System.Drawing.PointF(8 + (width – 16) * level, height – 10)
-
Arrow(1) = New System.Drawing.PointF(16 + (width – 16) * level, height – 2)
-
Arrow(2) = New System.Drawing.PointF(0 + (width – 16) * level, height – 2)
-
objGraphic.FillPolygon(System.Drawing.Brushes.Black, Arrow)
-
‚ Return the image as type bitmap
-
Return objBitmap
-
End Function
-
Function PaintBoxBmp(ByVal width As Integer, ByVal height As Integer, ByVal level As Single) As Byte()
-
‚ Wrapper function for PaintBox. This function is to be called from reporting services as
-
‚ for parameters see PaintBox
-
Dim bmpImage As System.Drawing.Bitmap
-
‚ Get bitmap from PaintBox
-
bmpImage = PaintBox(width, height, level)
-
‚ Convert this bitmap to a byte array of type BMP
-
Dim stream As System.IO.MemoryStream = New IO.MemoryStream
-
Dim bitmapBytes As Byte()
-
bmpImage.Save(stream, System.Drawing.Imaging.ImageFormat.Bmp)
-
bitmapBytes = stream.ToArray
-
stream.Close()
-
bmpImage.Dispose()
-
Return bitmapBytes
-
End Function
Examples
| PaintBox(100, 20, 0.0) | 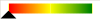 |
| PaintBox(100, 20, 1.0) | 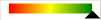 |
| PaintBox(100, 20, 0.5) | 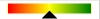 |
-
=Code.PaintBoxBmp(100,20,Fields!Sales_Amount.Value/Fields!Sales_Amount_Quota.Value)
Sample Expression:
-
=Code.PaintAbwBmp(100,20,Min(Fields!Value.Value, „DataSet1“),Max(Fields!Value.Value, „DataSet1“), Avg(Fields!Value.Value, „DataSet1“), Fields!Value.Value)


Kommentare (0)