Hello Everybody, today I would like to show you how you can create a dynamic Top N selection in Power BI which shows you the rest of the data (the data that is not in the Top N). The October Update brought us a cool new Top N filter for Power BI. This is an awesome feature, but there is missing one important piece: The possibility to show the rest of data that is not included in the Top N.
Actually this is a though problem for Power BI because of the tabular model. The value „Others“ does not exist in the column of a table (dimension). In Tabular Model you can only filter by values of columns, so if the value „Others“ is missing, it is not possible to show it on axis or to slice data with it. The task of adding an additional member to the dimension should be done by the front-end, but at the moment Power BI is not capable to this.
So how to solve this ?
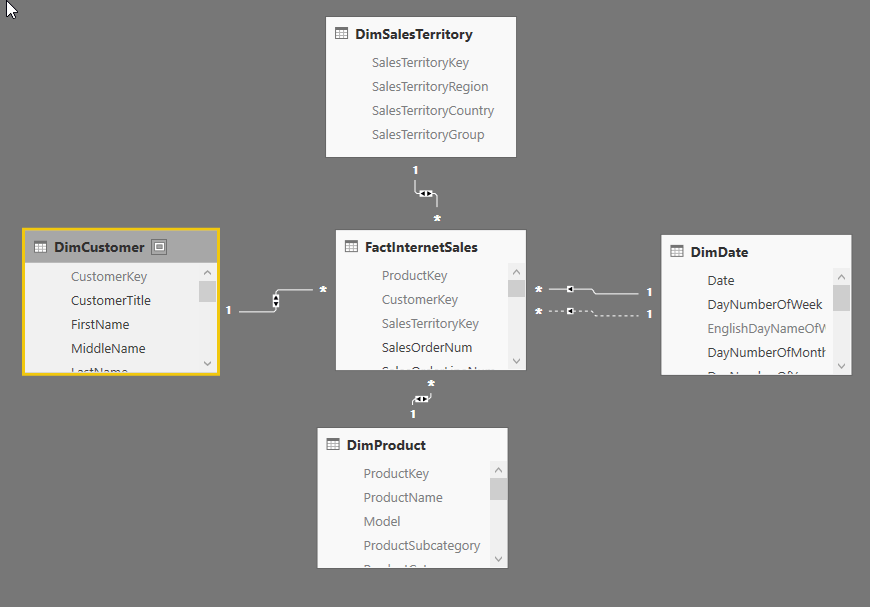
Let’s start at the beginning, in the following screenshot you can see my data model. The data is an import from Adventure Works. A fact table with 4 dimensions. In this scenario we look at the DimProduct Table and at the column [ProductName] in detail.
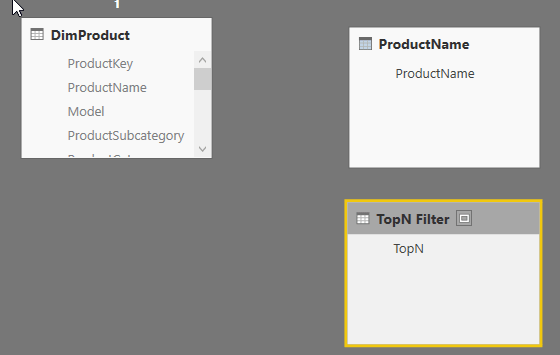
There is only one way to bring in the missing member „Others“ to the set, by creating a new table! For that I create a new table by using DAX. I do a simple union of our column [ProductName] with a new created row which has only one value
-
„Others“. ProductName = UNION ( VALUES ( DimProduct[ProductName] ); ROW ( „ProductName“; „Others“ ) )
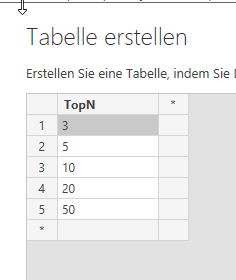
To give the user a maximum of flexibility I create a parameter table which contains the values {3,5,10,20,50}. The user can use this table with the column [TopN] later on to filter the report. If you are interessted in how this works I recommend the dax pattern from sqlbi .
Now I have two new tables in my data model. Both aren’t connected to any other table in the model. Since there is no physical relationship, I have to create a virtual relationship via dax by using a measure.
The column I like to use for my top n analysis is FactInternetSales[SalesAmt]. To keep things simple I create a measure. Sum of Sales Amount := SUM ( FactInternetSales[SalesAmt] ) Now I create 2 measures [Top X] and [Others]. Keep in mind that we have to use our new dummy column ProductName[ProductName], because this column contains the needed value „Others“. [Top X] will calculate the Sales Amount for only the top n values from column ProductName[ProductName]. The tricky part is that there is no physical relationship, so we have to create a virtual one.
-
Top X =
-
VAR TopNumber =
-
IF ( HASONEVALUE ( ‚TopN Filter‘&SQUARE_BRACKETS_OPEN;TopN] ); VALUES ( ‚TopN Filter‘[TopN] ); 10 )
-
VAR Rest =
-
COUNTROWS ( DimProduct ) – TopNumber
-
RETURN
-
IF (
-
HASONEVALUE ( ProductName[ProductName] );
-
CALCULATE (
-
[Sum of Sales Amount];
-
FILTER (
-
DimProduct;
-
[ProductName] = VALUES ( ProductName[ProductName] )
-
&& CONTAINS (
-
TOPN (
-
TopNumber;
-
ADDCOLUMNS (
-
ALL ( ProductName[ProductName] );
-
„Sales“; CALCULATE (
-
[Sum of Sales Amount];
-
FILTER ( DimProduct; DimProduct[ProductName] = EARLIER ( [ProductName] ) )
-
)
-
);
-
[Sales]; DESC
-
);
-
ProductName[ProductName]; VALUES ( ProductName[ProductName] )
-
)
-
)
-
)
-
)
To explain the measure, the best way is to start with the innermoste function:
- ADDCOLUMNS: Calculates the Sales Amount for all our rows in the dummy table (ProductName). It returns a table which contains the Sales Amount of all ProductName’s from ProductName[ProductName]
- TOP N: The TOPN filters the calcualted table from ADDCOLUMNS to the needed amount of top products.
- FILTER and CONTAINS : We filter DimProduct so that only those rows remain that are in our TOPN Table. We do this by comparing the names of the products (both [ProductName] columns)
- CALCUALTE: In the end DimProduct is filtered to the correct number rows (the top products). This filter context is handed into the [Sum of Sales Amount] calculation.
- The HASONEVALUE are needed to prevent DAX from returning an error if more than one value ist returned for ProductName[ProductName] for example in the total of a calculation.
The [Others] measure is a bit more simple. The trick here is that we have to calcualte the number of rows that are not in the top n. For that I create the variable REST, which returns the number of rows from DimProduct which are not in the top n. We create a calcualted table (ADDCOLUMNS) which is filtered by the inverted top N (Rest). The „ASC“ parameter in TOPN allows us to get the not top n rows from ProductName. After that we only have to sum this new calculated table. The sum is only shown when the values of
-
Other =
-
VAR TopNumber =
-
IF ( HASONEVALUE ( ‚TopN Filter‘&SQUARE_BRACKETS_OPEN;TopN] ); VALUES ( ‚TopN Filter‘[TopN] ); 10 )
-
VAR Rest =
-
COUNTROWS ( DimProduct ) – TopNumber
-
RETURN
-
IF (
-
HASONEVALUE ( ProductName[ProductName] );
-
IF (
-
VALUES ( ProductName[ProductName] ) = „Others“;
-
SUMX (
-
TOPN (
-
Rest;
-
ADDCOLUMNS (
-
VALUES ( DimProduct[ProductName] );
-
„Measure“; [Sum of Sales Amount]
-
);
-
[Measure]; ASC
-
);
-
[Measure]
-
)
-
)
-
)
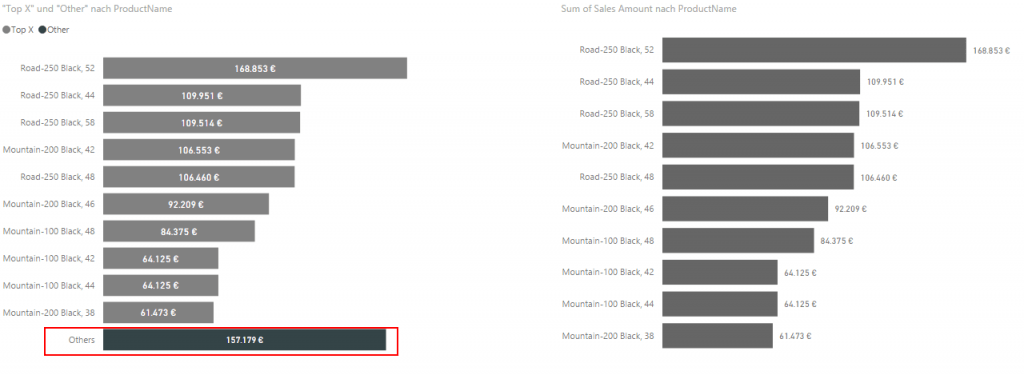
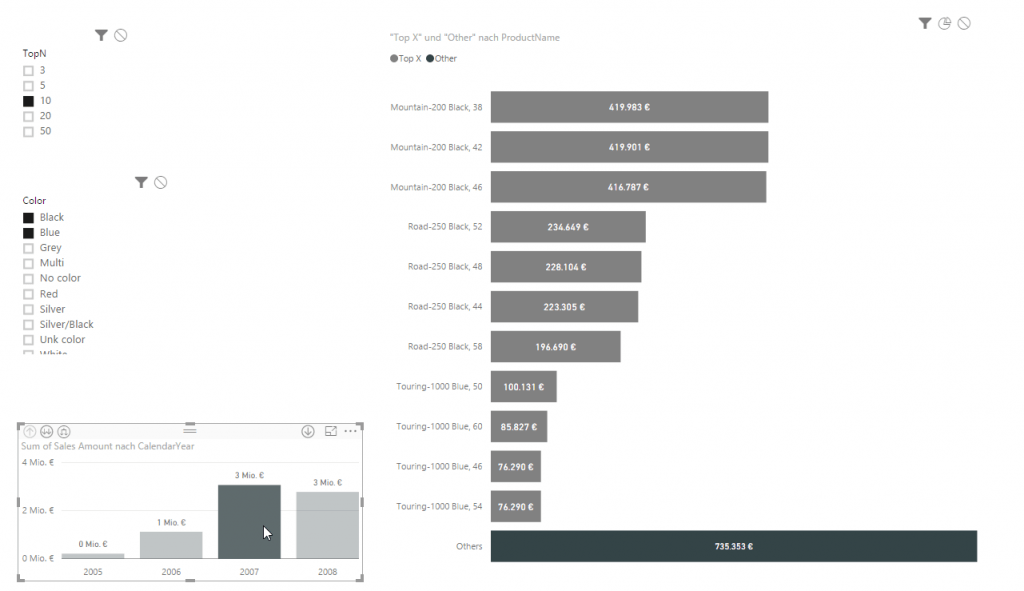
Now that everything is ready we can create a chart with our dummy column ProductName[ProductName] on the axis and our both measure as values. The measure is full interactive, so you can filter the table DimDate or the DimProduct itself. Everything is calculated dynamically on the fly. You can try it yourself by clicking on the next screenshot.
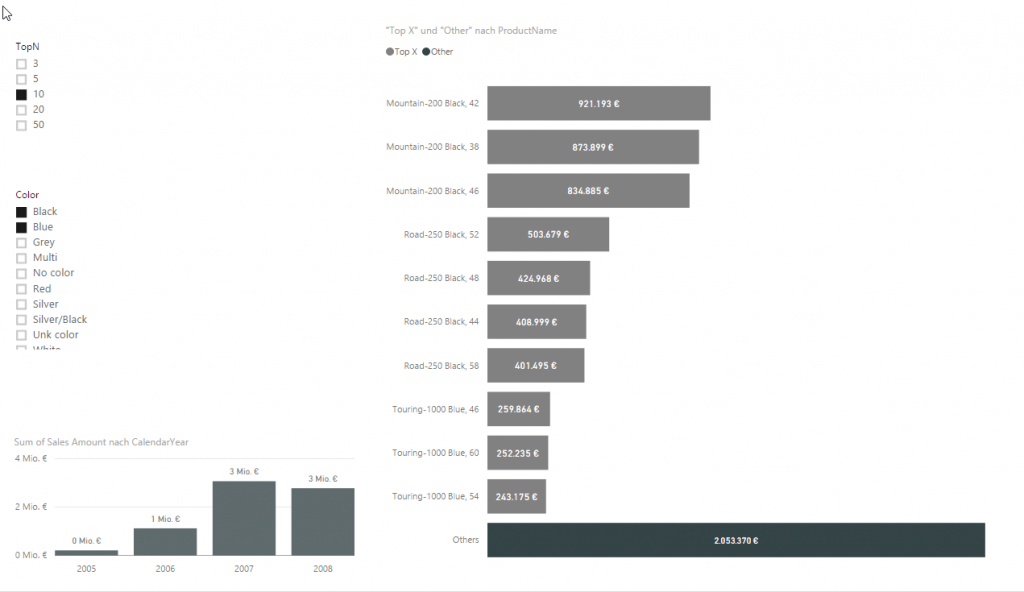
Conclusion:
In this post I showed you how to create a dynamical top n/rest analysis. To be honest, I think it should be much easier to do that kind of analysis, but at the moment Power BI is missing this feature. The used DAX measure is a little bit complex, but still manageable. The big drawback of this solution is that I had to create a dummy table to get the members „Others“ into the set. So you have to know which attributes your user likes to analyze by top n/rest approach. But it is always nice to have a pattern for recurring problems. I hope you find it helpful.
Update
You can try it out right here:
Download the file.
This is a much discussed article and I’m very happy that this article helped some many of you. Some of you have sent me mails or used the comment function in the blog to contact me. I’m very sorry, but for me it is not possible to answer detailed questions. It is always very time consuming and I often need more background information about your model, your data and your skill level.
Regards Lukas


Kommentare (0)