Hello All, in this blog post I’ll show you how you can use regular expressions in Power BI by using the R transformation steps. Power BI itself is not capable to filter or select by a regular expression. It is a favored feature by some users (see community), but until now there is no way to use regular expressions in Power BI.
Last Week I tried to import data from imdb.com. The IMDB hosts a free FTP Server where everyone can download ratings, budget numbers, gross sales and much more for plenty of movies and tv shows. The problem is that these text files aren’t formated very well. So I used Power BI to clean up a little bit. For this blog post I only used the Top 250 movies of all times. These movies are stored in the ratings.ls file. You can see my transformation steps in M below.
-
let
-
Source = Binary.Decompress(Web.Contents(„ftp://ftp.fu-berlin.de/pub/misc/movies/database/ratings.list.gz“),Compression.GZip),
-
#“Imported CSV“ = Csv.Document(Source,4,“|<„,null,1252),
-
#“Changed Type“ = Table.TransformColumnTypes(#“Imported CSV“,{{„Column1“, type text}, {„Column2“, type text}, {„Column3“, type text}, {„Column4“, type text}}),
-
#“Removed Columns“ = Table.RemoveColumns(#“Changed Type“,{„Column2“, „Column3“, „Column4“}),
-
#“Removed Top Rows“ = Table.Skip(#“Removed Columns“,27),
-
#“Kept First Rows“ = Table.FirstN(#“Removed Top Rows“,251),
-
#“Trimmed Text“ = Table.TransformColumns(#“Kept First Rows“,{},Text.Trim),
-
#“Cleaned Text“ = Table.TransformColumns(#“Trimmed Text“,{},Text.Clean),
-
#“Replaced Value“ = Table.ReplaceValue(#“Cleaned Text“,“ „,“ „,Replacer.ReplaceText,{„Column1“}),
-
#“Replaced Value1″ = Table.ReplaceValue(#“Replaced Value“,“ „,“ „,Replacer.ReplaceText,{„Column1“}),
-
#“Split Column by Delimiter“ = Table.SplitColumn(#“Replaced Value1″,“Column1″,Splitter.SplitTextByEachDelimiter({“ „}, QuoteStyle.Csv, false),{„Column1.1“, „Column1.2“}),
-
#“Split Column by Delimiter1″ = Table.SplitColumn(#“Split Column by Delimiter“,“Column1.2″,Splitter.SplitTextByEachDelimiter({“ „}, QuoteStyle.Csv, false),{„Column1.2.1“, „Column1.2.2“}),
-
#“Split Column by Delimiter2″ = Table.SplitColumn(#“Split Column by Delimiter1″,“Column1.2.2″,Splitter.SplitTextByEachDelimiter({“ „}, QuoteStyle.Csv, false),{„Column1.2.2.1“, „Column1.2.2.2“}),
-
#“Changed Type1″ = Table.TransformColumnTypes(#“Split Column by Delimiter2″,{{„Column1.1“, type text}, {„Column1.2.1“, type text}, {„Column1.2.2.1“, type text}, {„Column1.2.2.2“, type text}}),
-
#“Promoted Headers“ = Table.PromoteHeaders(#“Changed Type1″),
-
#“Replaced Value2″ = Table.ReplaceValue(#“Promoted Headers“,“.“,“,“,Replacer.ReplaceText,{„Votes“}),
-
#“Changed Type2″ = Table.TransformColumnTypes(#“Replaced Value2″,{{„Votes“, type number}}),
-
#“Renamed Columns“ = Table.RenameColumns(#“Changed Type2″,{{„Votes“, „Rank“}, {„Distribution“, „Vote“}}),
-
#“Removed Columns1″ = Table.RemoveColumns(#“Renamed Columns“,{„New“}),
-
#“Renamed Columns1″ = Table.RenameColumns(#“Removed Columns1″,{{„Rank Title“, „Title“}})
-
-
in
-
#“Renamed Columns1″
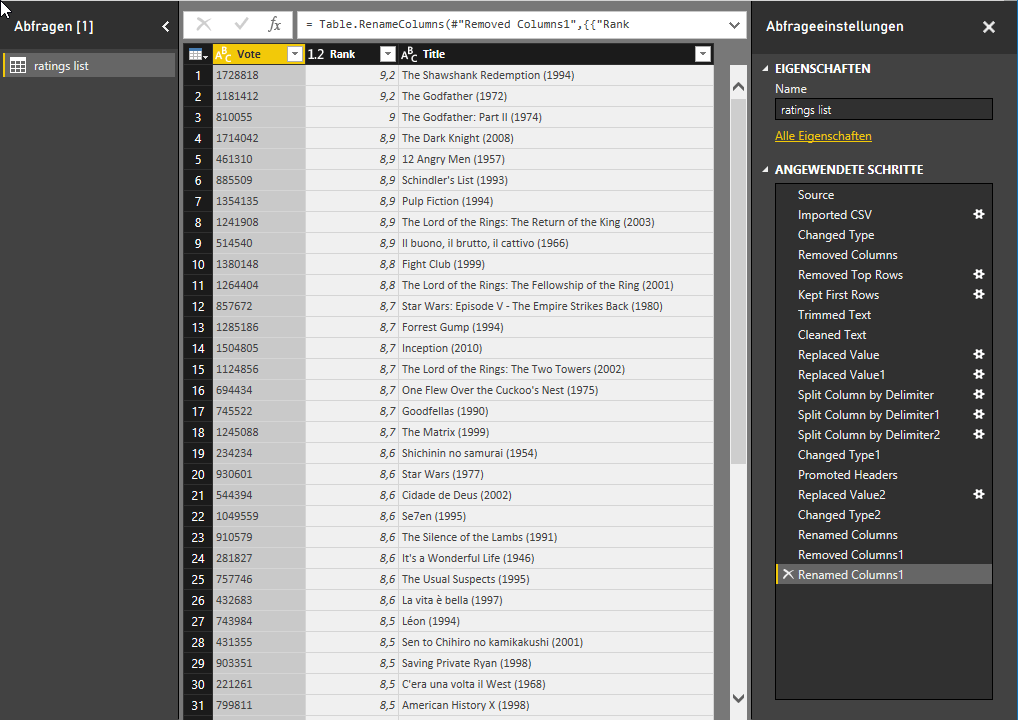
Everything worked fine until I tried to derive the release year from the movie title. If you look at the Top 250 this seems easy, because the titles in this small list are very well structured. The pattern is always „Title (Year)“. If you look at the full dataset things look a little bit different. I found no way to handle these irregularities with the Query Editor. The optimal way I think is to use a regular expression like this one \((19|20)\d{2}‘. It searches for a string which starts with a ‚(‚ followed by 19 or 20 and two more digits.
I was close to give up, but then I rembered a feature of Power BI which allows to run R scripts in context of the Query Editor, Link . With this „Run R Script“ step you can hand the full dataset from the editor to R. And there you can do some transformation with R and return the transformed dataset to Power BI. So I wrote a little R script.
-
# ‚dataset‘ contains the input data from Power BI
-
library(stringr)
-
# Create a dataset to store the data, this dataset will be returned to Power BI
-
ResultSet<-data.frame(dataset)
-
# We write a little function, which uses the str_extract function to use regular Expression
-
Splitter = function(x) substr(str_extract(x,‚\\((19|20)\\d{2}‘),2,5)
-
Add a new Column to our result dataframe
-
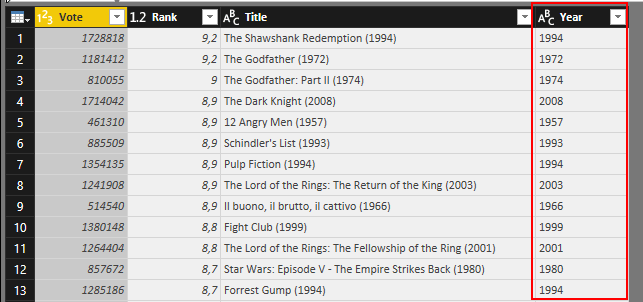
ResultSet[[„Year“]] <- apply(ResultSet[3],1, function(x) Splitter(x) )
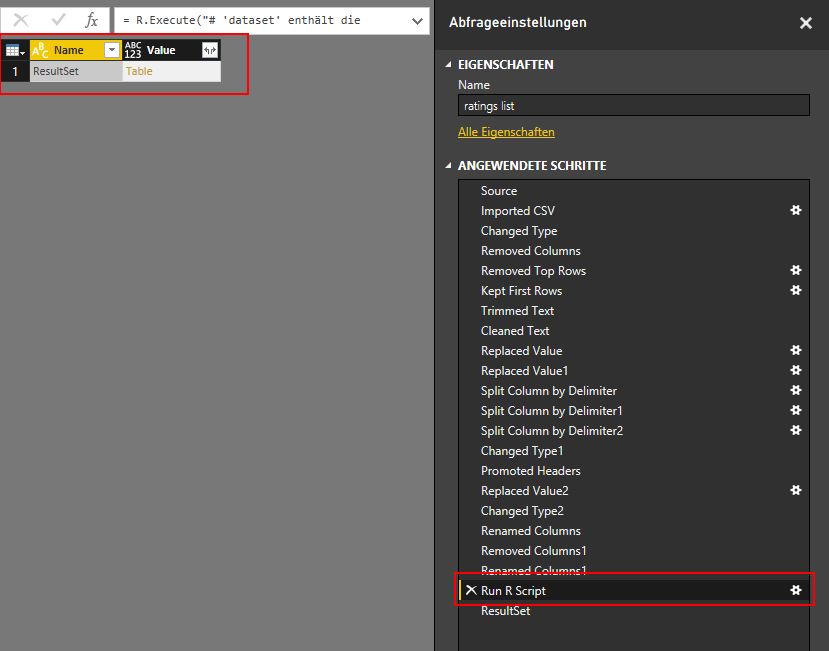
Now there is a new step inside the Query Editor, which returns my dataset in a table.
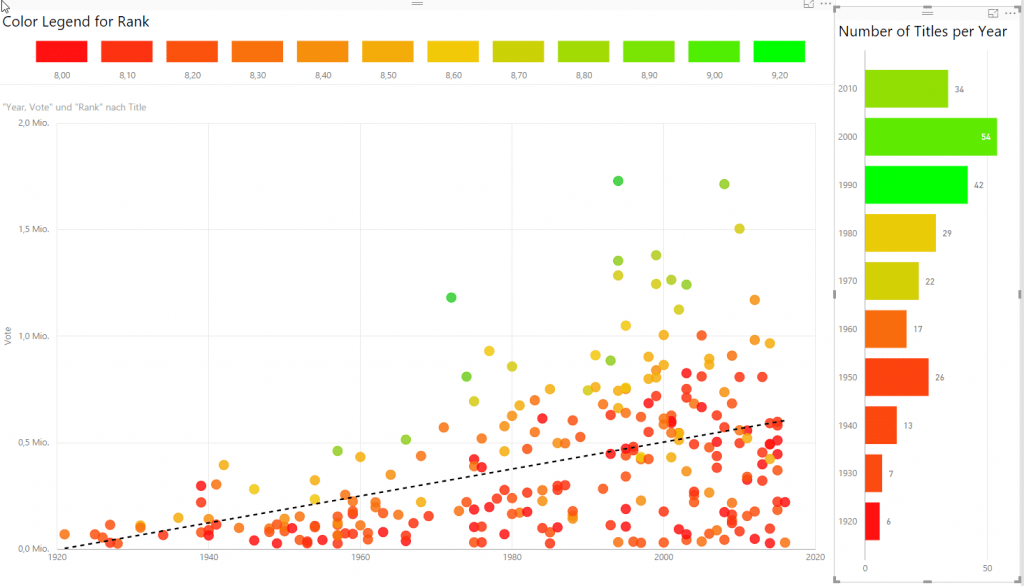
Now I have all the information I need and I can create a little chart which shows me how the Top 250 are distributed over time. It seems like newer movies get better votes and rank over time. You can explore the Power BI report yourself by clicking on the screenshot of the Power BI report.
In this blog post I showed you how you can use regular expressions in Power BI. I think this is a cool example how R Scripts can be used to make Power BI even better.
Thanks for reading! I wish you all a Merry Christmas and a happy new year.
I will follow up in 2017!


Kommentare (0)