SQL Server 2005
Sascha Lorenz posted the source code for creating win/loss charts in his blog . I really like this kind of charts as it is especially useful for sparklines. Sascha created the bitmap for the chart dynamically on demand using ASP.NET. I thought this could be a great idea for our interactive graphics from the previous posts so that we can easily define them inside the cube and use them in a SSRS report.
First, let’s look at the result:
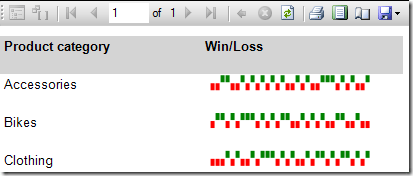
The underlying data is just an example. It shows the days on which the order amount is higher (green) or lower (red) compared to the previous day covering the last 32 days.
The MDX query for our report looks like this:
-
WITH
-
MEMBER [WLPlot] AS
-
ASStatistics.WinLossChart(
-
tail(
-
nonempty(
-
[Date].[Date].[Date],
-
[Measures].[Sales Amount]),32),
-
[Measures].[Sales Amount], (
-
[Measures].[Sales Amount],
-
[Date].[Date].currentmember.prevmember))
-
SELECT
-
{
-
[WLPlot],
-
[Gross Profit Margin]
-
} ON 0,
-
[Product].[Category].[Category] ON 1
-
FROM [Adventure Works]
I turned Sascha’s function into a stored procedure named WinLossChart. WinLossChart takes three arguments:
| Argument | Description |
| inputset | The set over which the expressions are to be evaluated |
| valueExpression | The expression for the value |
| thresholdExpression | The expression for the threshold |
If the value is higher than the threshold we paint a green bar, if it is lower, we paint a red bar. For the simple example above we made Sales Amount the value expression and the Sales Amount of the previous day the threshold expression. Of course, the threshold could also be a simple constant.
So, here’s the code for the stored procedure. The first function returns the bitmap and is very close to the code Sascha posted in his blog entry:
-
public static Bitmap CreateWinLossBitmap(double[] q, double[] threshold)
-
{
-
int i;
-
int l = q.Length;
-
Bitmap objBitmap = new Bitmap(5 * l + 20, 22);
-
Graphics objGraphic = Graphics.FromImage(objBitmap);
-
objGraphic.FillRectangle(Brushes.White, 0, 0, 5 * l + 20, 30);
-
for (i = 0; i < l; ++i)
-
{
-
if (q[i] == Double.MinValue)
-
objGraphic.FillRectangle(Brushes.Gray, 10 + (i * 5), 9, 4, 4);
-
else
-
if (q[i] > threshold[i])
-
objGraphic.FillRectangle(Brushes.Green, 10 + (i * 5), 2, 4, 7);
-
else
-
objGraphic.FillRectangle(Brushes.Red, 10 + (i * 5), 10, 4, 7);
-
}
-
return objBitmap;
-
}
And here’s the function wrapping the above code into a SSAS stored procedure. This is the function we’re calling from MDX:
-
public static string WinLossChart(Set inputset, Expression valueExpression, Expression thresholdExpression)
-
{
-
double[] q = new double[inputset.Tuples.Count];
-
double[] thr = new double[inputset.Tuples.Count];
-
int idx = 0;
-
foreach (Tuple tuple in inputset)
-
{
-
q[idx] = valueExpression.Calculate(tuple).ToDouble();
-
thr[idx] = thresholdExpression.Calculate(tuple).ToDouble();
-
idx++;
-
}
-
Bitmap bmp = CreateWinLossBitmap(q, thr);
-
MemoryStream IS = new MemoryStream();
-
bmp.Save(IS, ImageFormat.Png);
-
IS.Flush();
-
return Convert.ToBase64String(IS.ToArray());
-
}
For building the library you need references to
-
Microsoft.AnalysisServices (Microsoft.AnalysisServices.dll)
-
Microsoft.AnalysisServices.AdomdClient (Microsoft.AnalysisServices.AdomdClient.dll)
-
Microsoft.AnalysisServices.XMLA (Microsoft.AnalysisServices.XMLA.dll)
-
msmgdsrv (msmgdsrv.dll)
If you don’t have the above assemblies installed on your machine you can take them from a SQL Server installation and install them to the global assembly cache (GAC) using
-
Gacutil.exe /i assembly_name.dll
You also have to add references on these libraries to your C# project like this:
-
<ItemGroup>
-
<Reference Include=„Microsoft.AnalysisServices, Version=9.0.242.0, Culture=neutral, PublicKeyToken=89845dcd8080cc91, processorArchitecture=MSIL“>
-
<SpecificVersion>False</SpecificVersion>
-
</Reference>
-
<Reference Include=„Microsoft.AnalysisServices.AdomdClient, Version=9.0.242.0, Culture=neutral, PublicKeyToken=89845dcd8080cc91, processorArchitecture=MSIL“>
-
<SpecificVersion>False</SpecificVersion>
-
</Reference>
-
<Reference Include=„Microsoft.AnalysisServices.XMLA, Version=9.0.242.0, Culture=neutral, PublicKeyToken=89845dcd8080cc91, processorArchitecture=MSIL“>
-
<SpecificVersion>False</SpecificVersion>
-
</Reference>
-
<Reference Include=„msmgdsrv, Version=9.0.0.0, Culture=neutral, PublicKeyToken=89845dcd8080cc91, processorArchitecture=x86“>
-
<SpecificVersion>False</SpecificVersion>
-
<Private>False</Private>
-
</Reference>
-
…
-
</ItemGroup>
Of course the code above is just to show the basic idea and should be rewritten for a productive environment.
Thanks to Sascha for the visualization. Again, I recommend reading his blog entry for the original code.


Kommentare (0)